Coronavirus: A visual guide to the outbreak
Posted on February 10th, 2020
A fast-moving virus known as the “new coronavirus” has infected thousands of Chinese citizens and spread to more than 20 countries.
The respiratory infection, which causes pneumonia-like symptoms, has claimed more than 900 lives so far – more than the 774 killed in the 2003 Sars epidemic.
The outbreak, originating in the Chinese city of Wuhan, has been declared a global emergency by the World Health Organization (WHO).
Here are 10 maps and graphics that will help you understand what is going on.
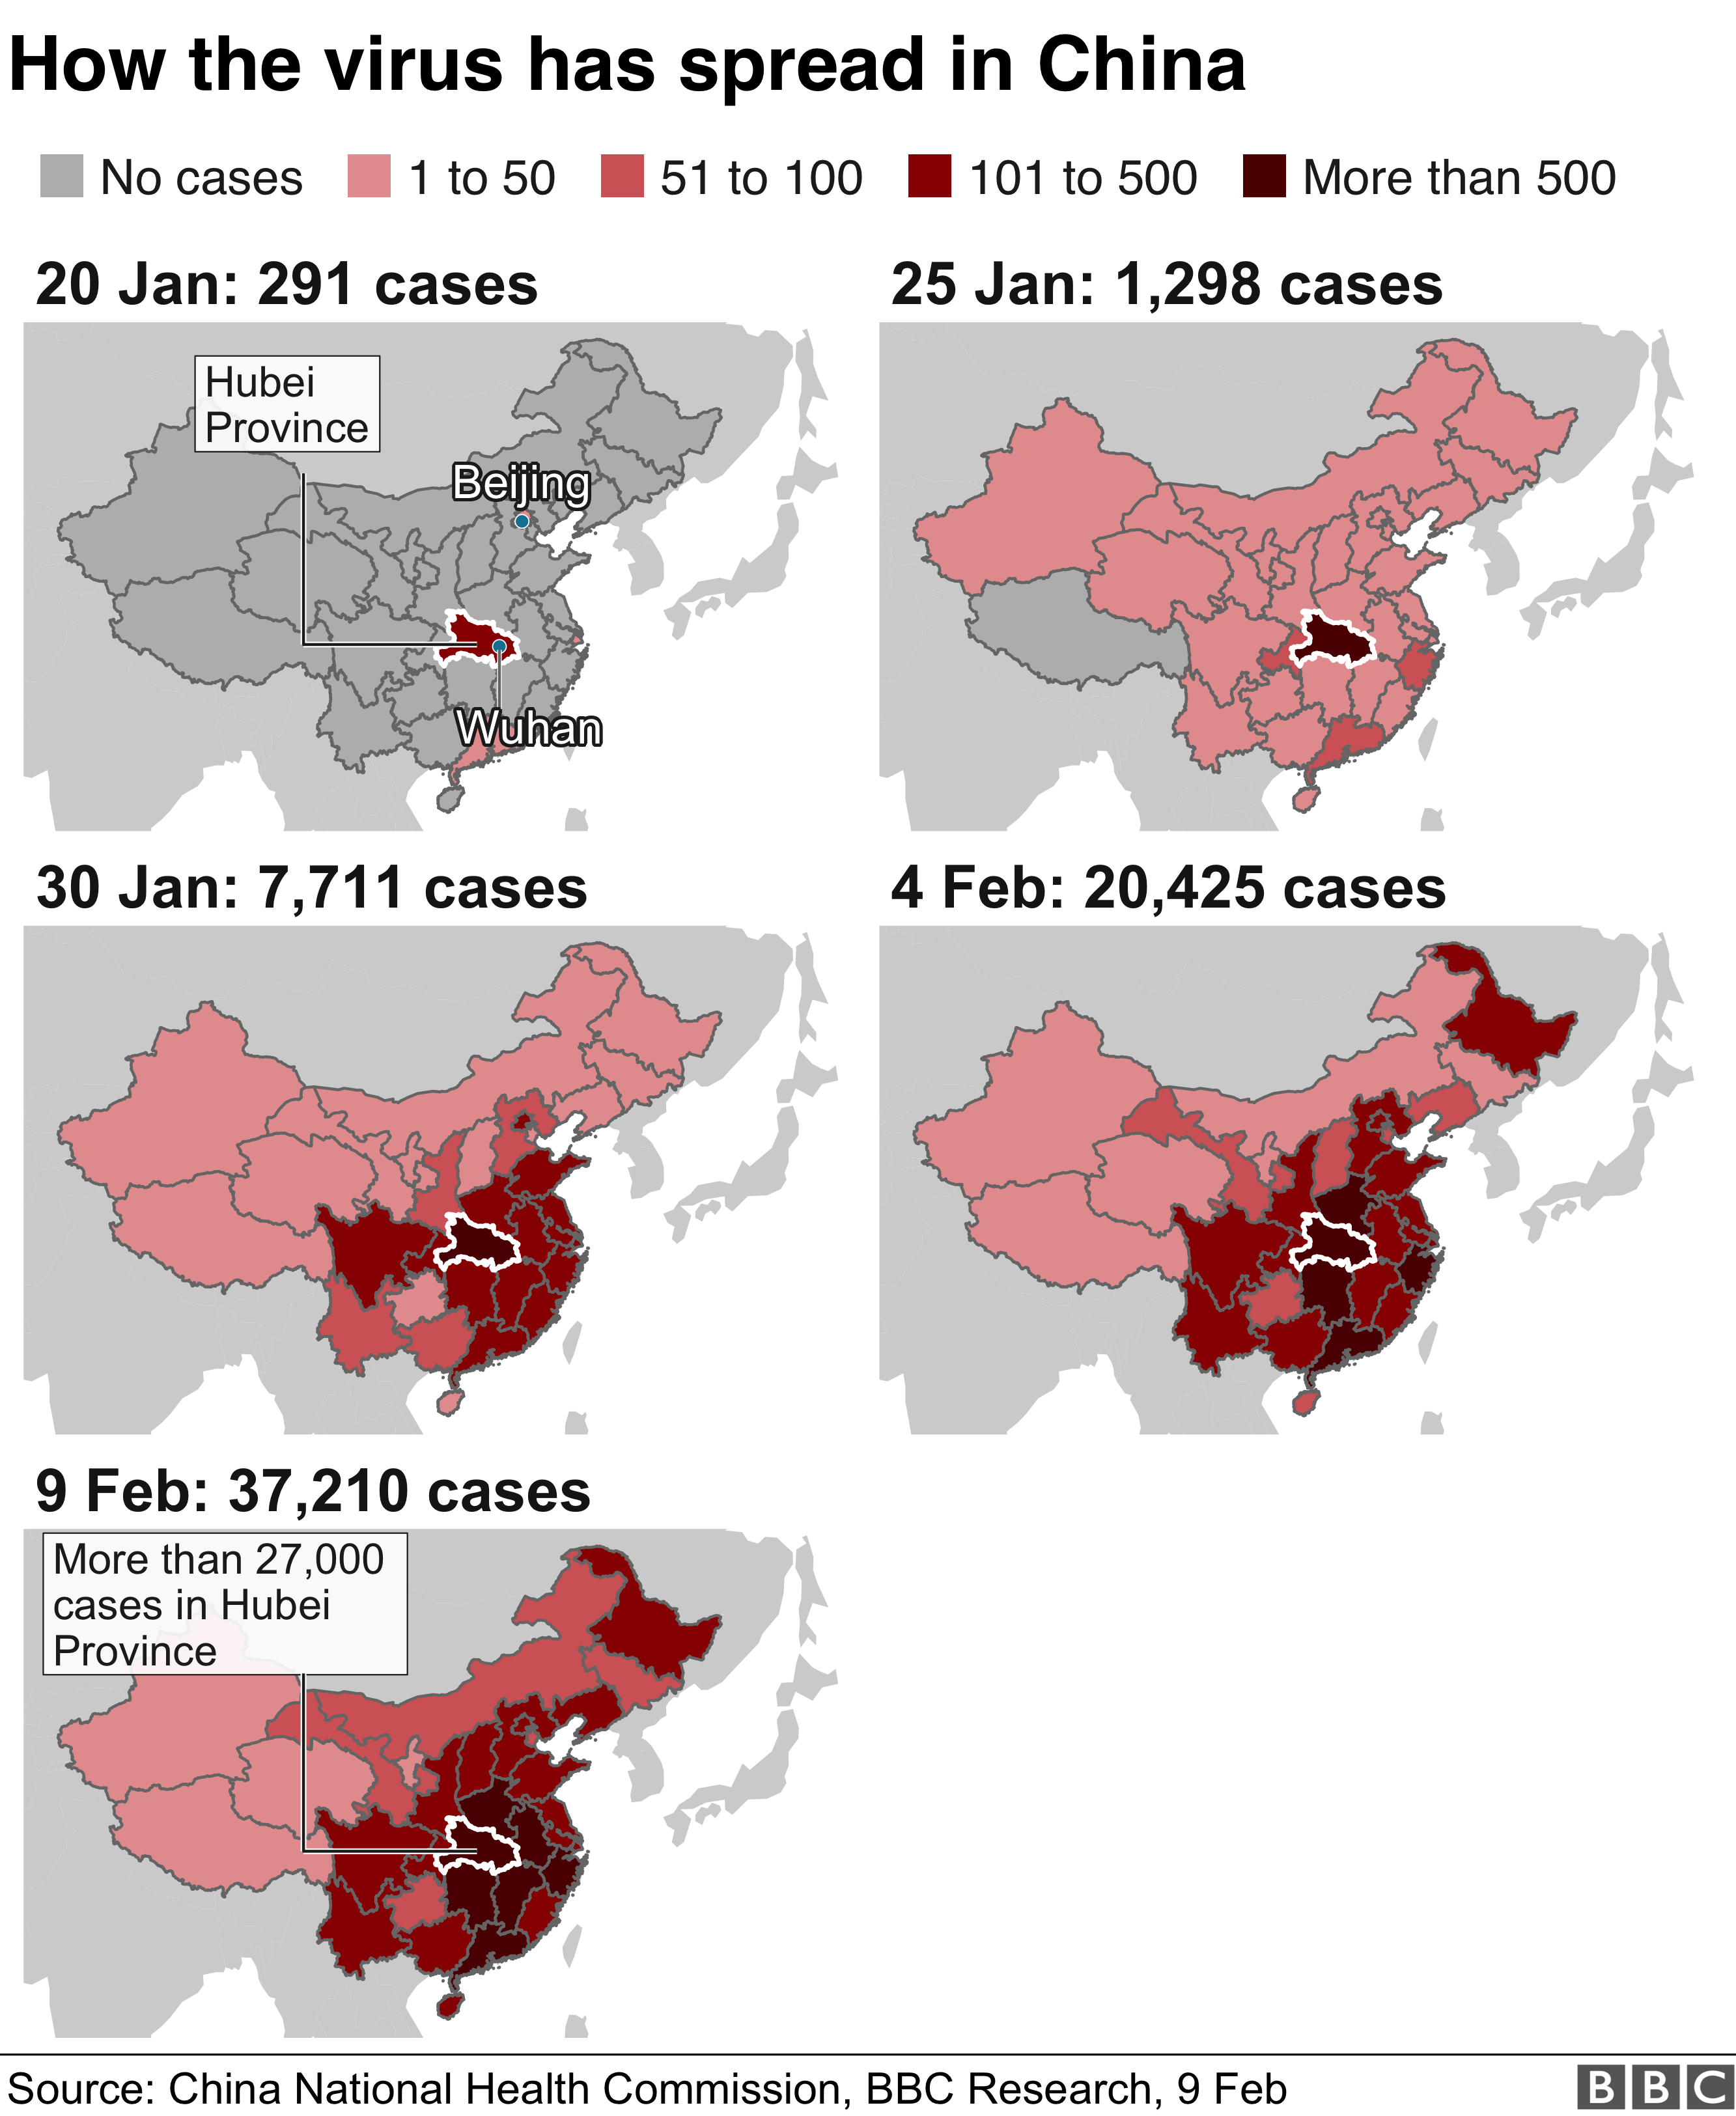
1. There have been thousands of cases – the majority in China
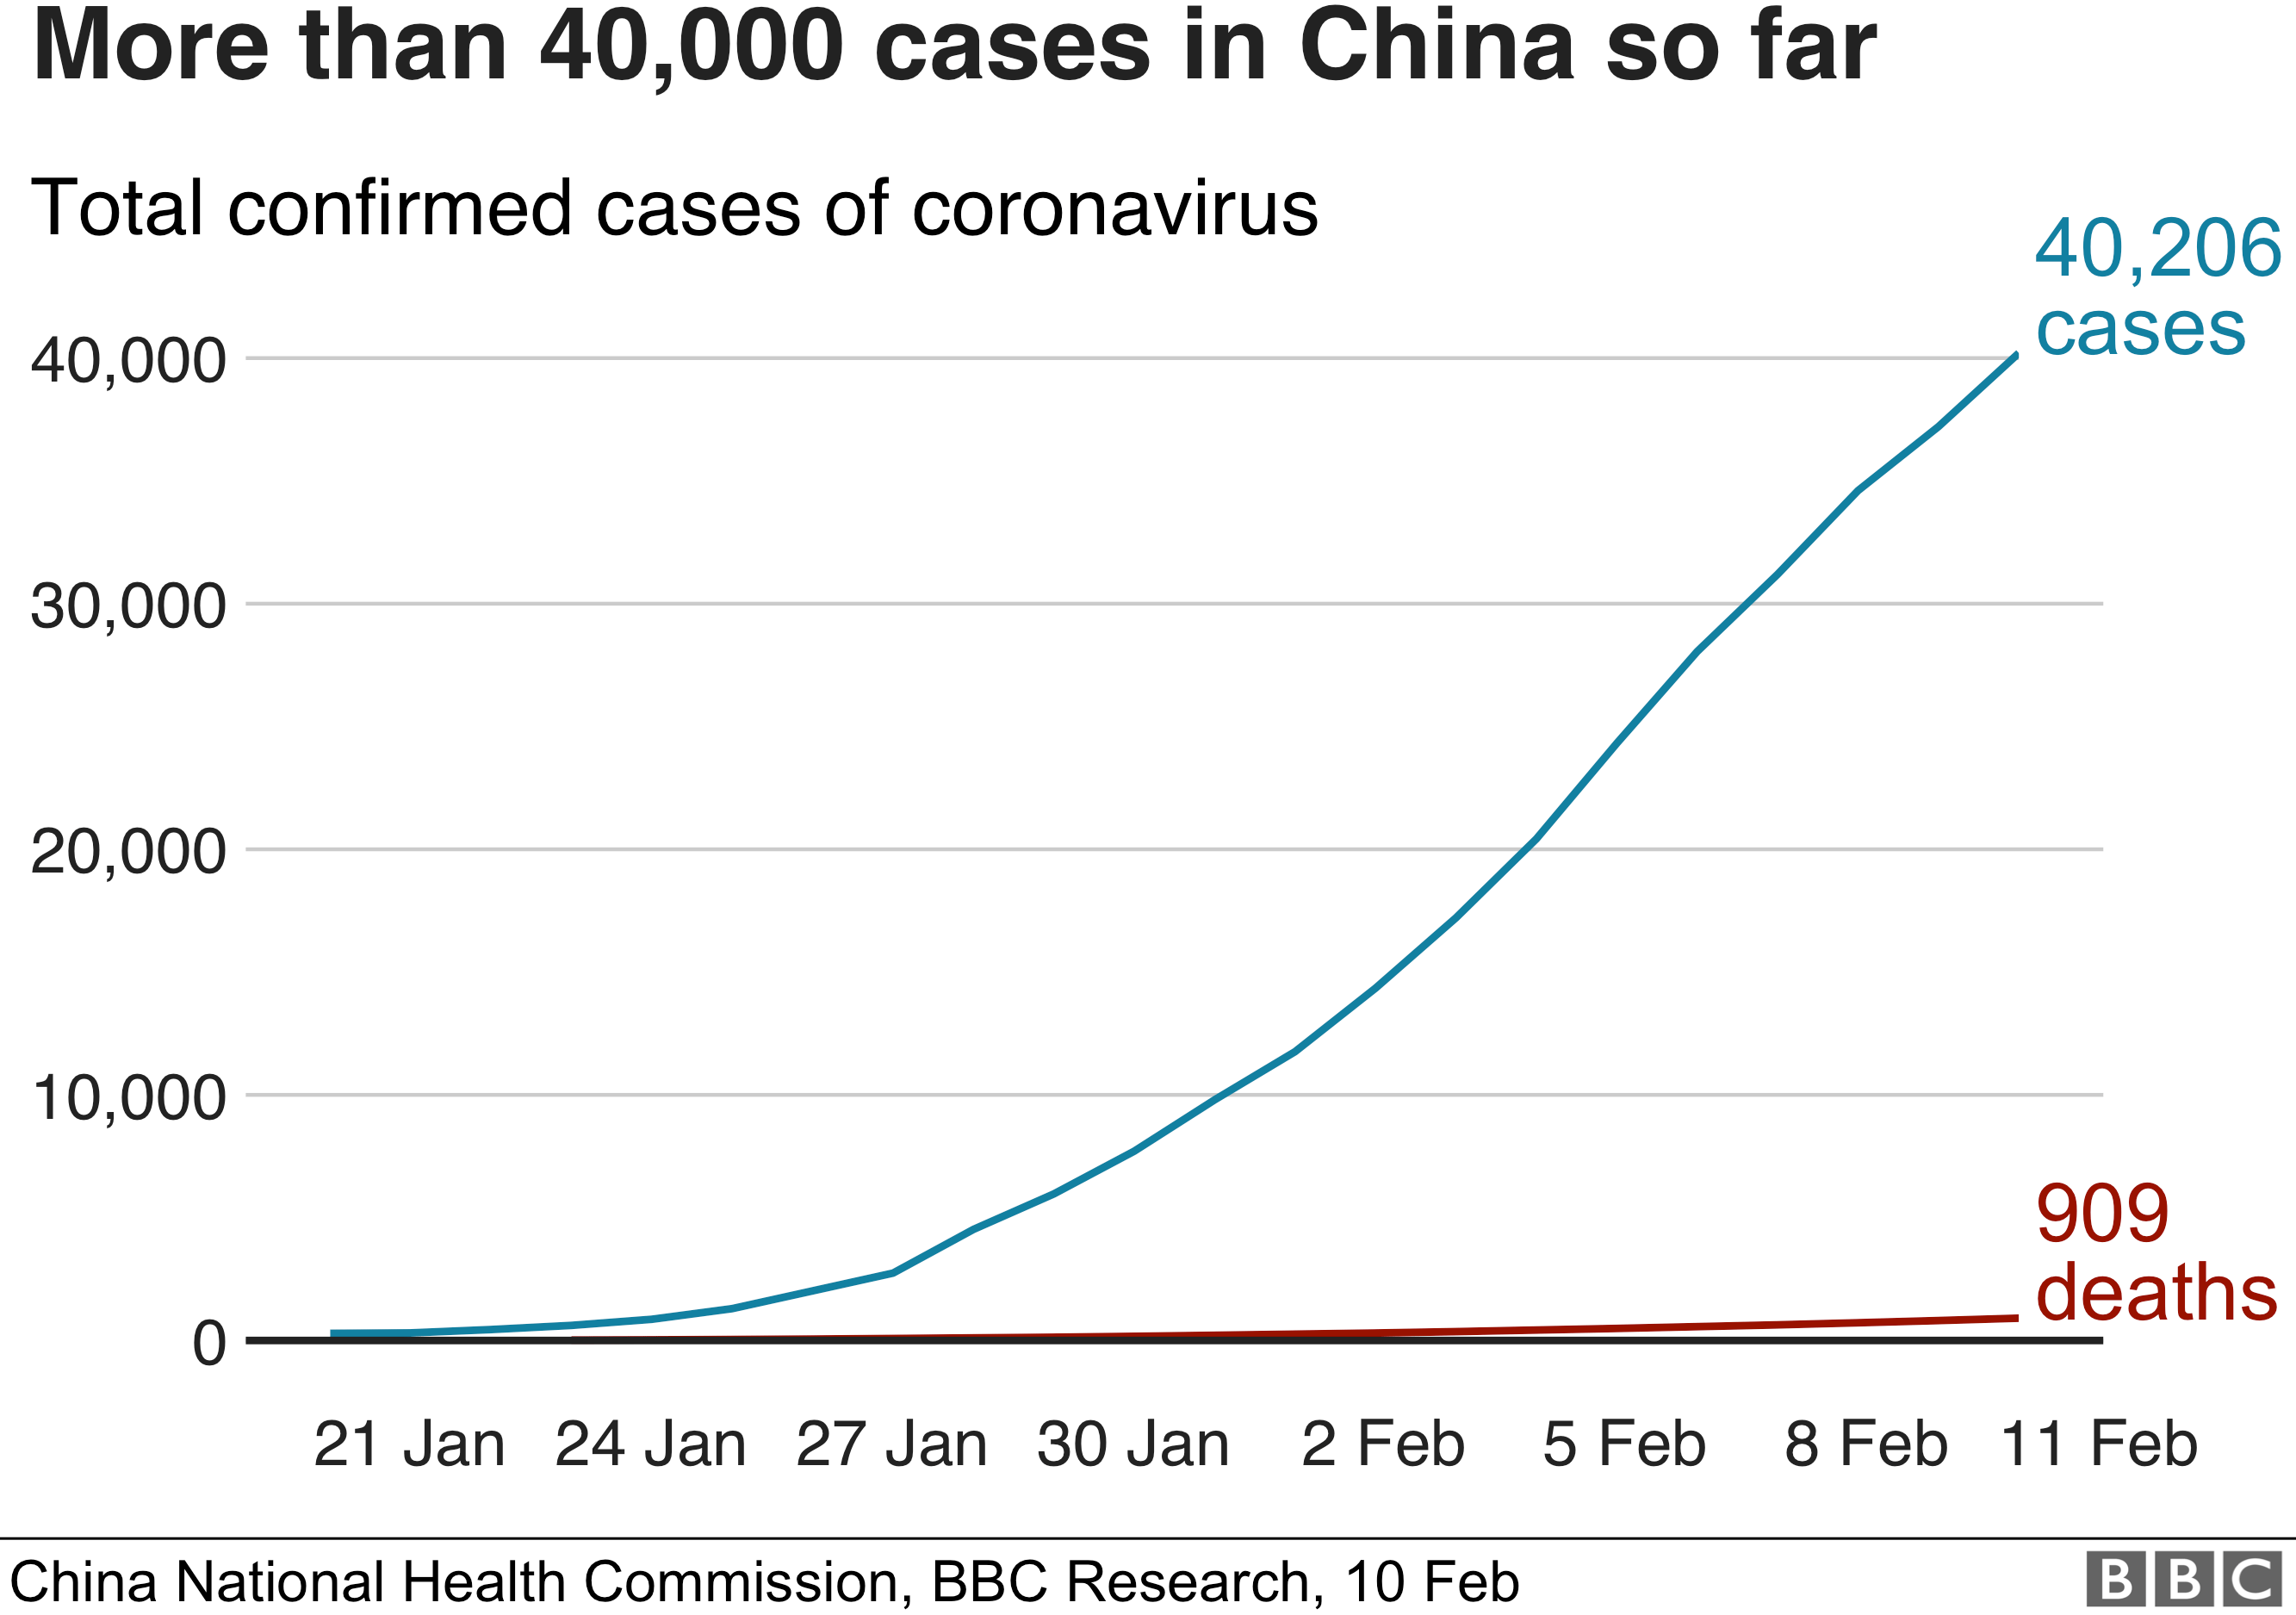
Across China, thousands of people have been infected with the coronavirus, with thousands more under medical observation.
The WHO has warned the number of cases is likely to rise further.
The WHO has warned the number of cases is likely to rise further.
But while the overall number of cases continues to rise, the latest figures released by the Chinese National Health Commission show the number of new daily confirmed cases has begun to decline from a peak on 5 February.
The number of new cases in China is “stabilising”, the WHO says, but it is too early to say if the virus has peaked.
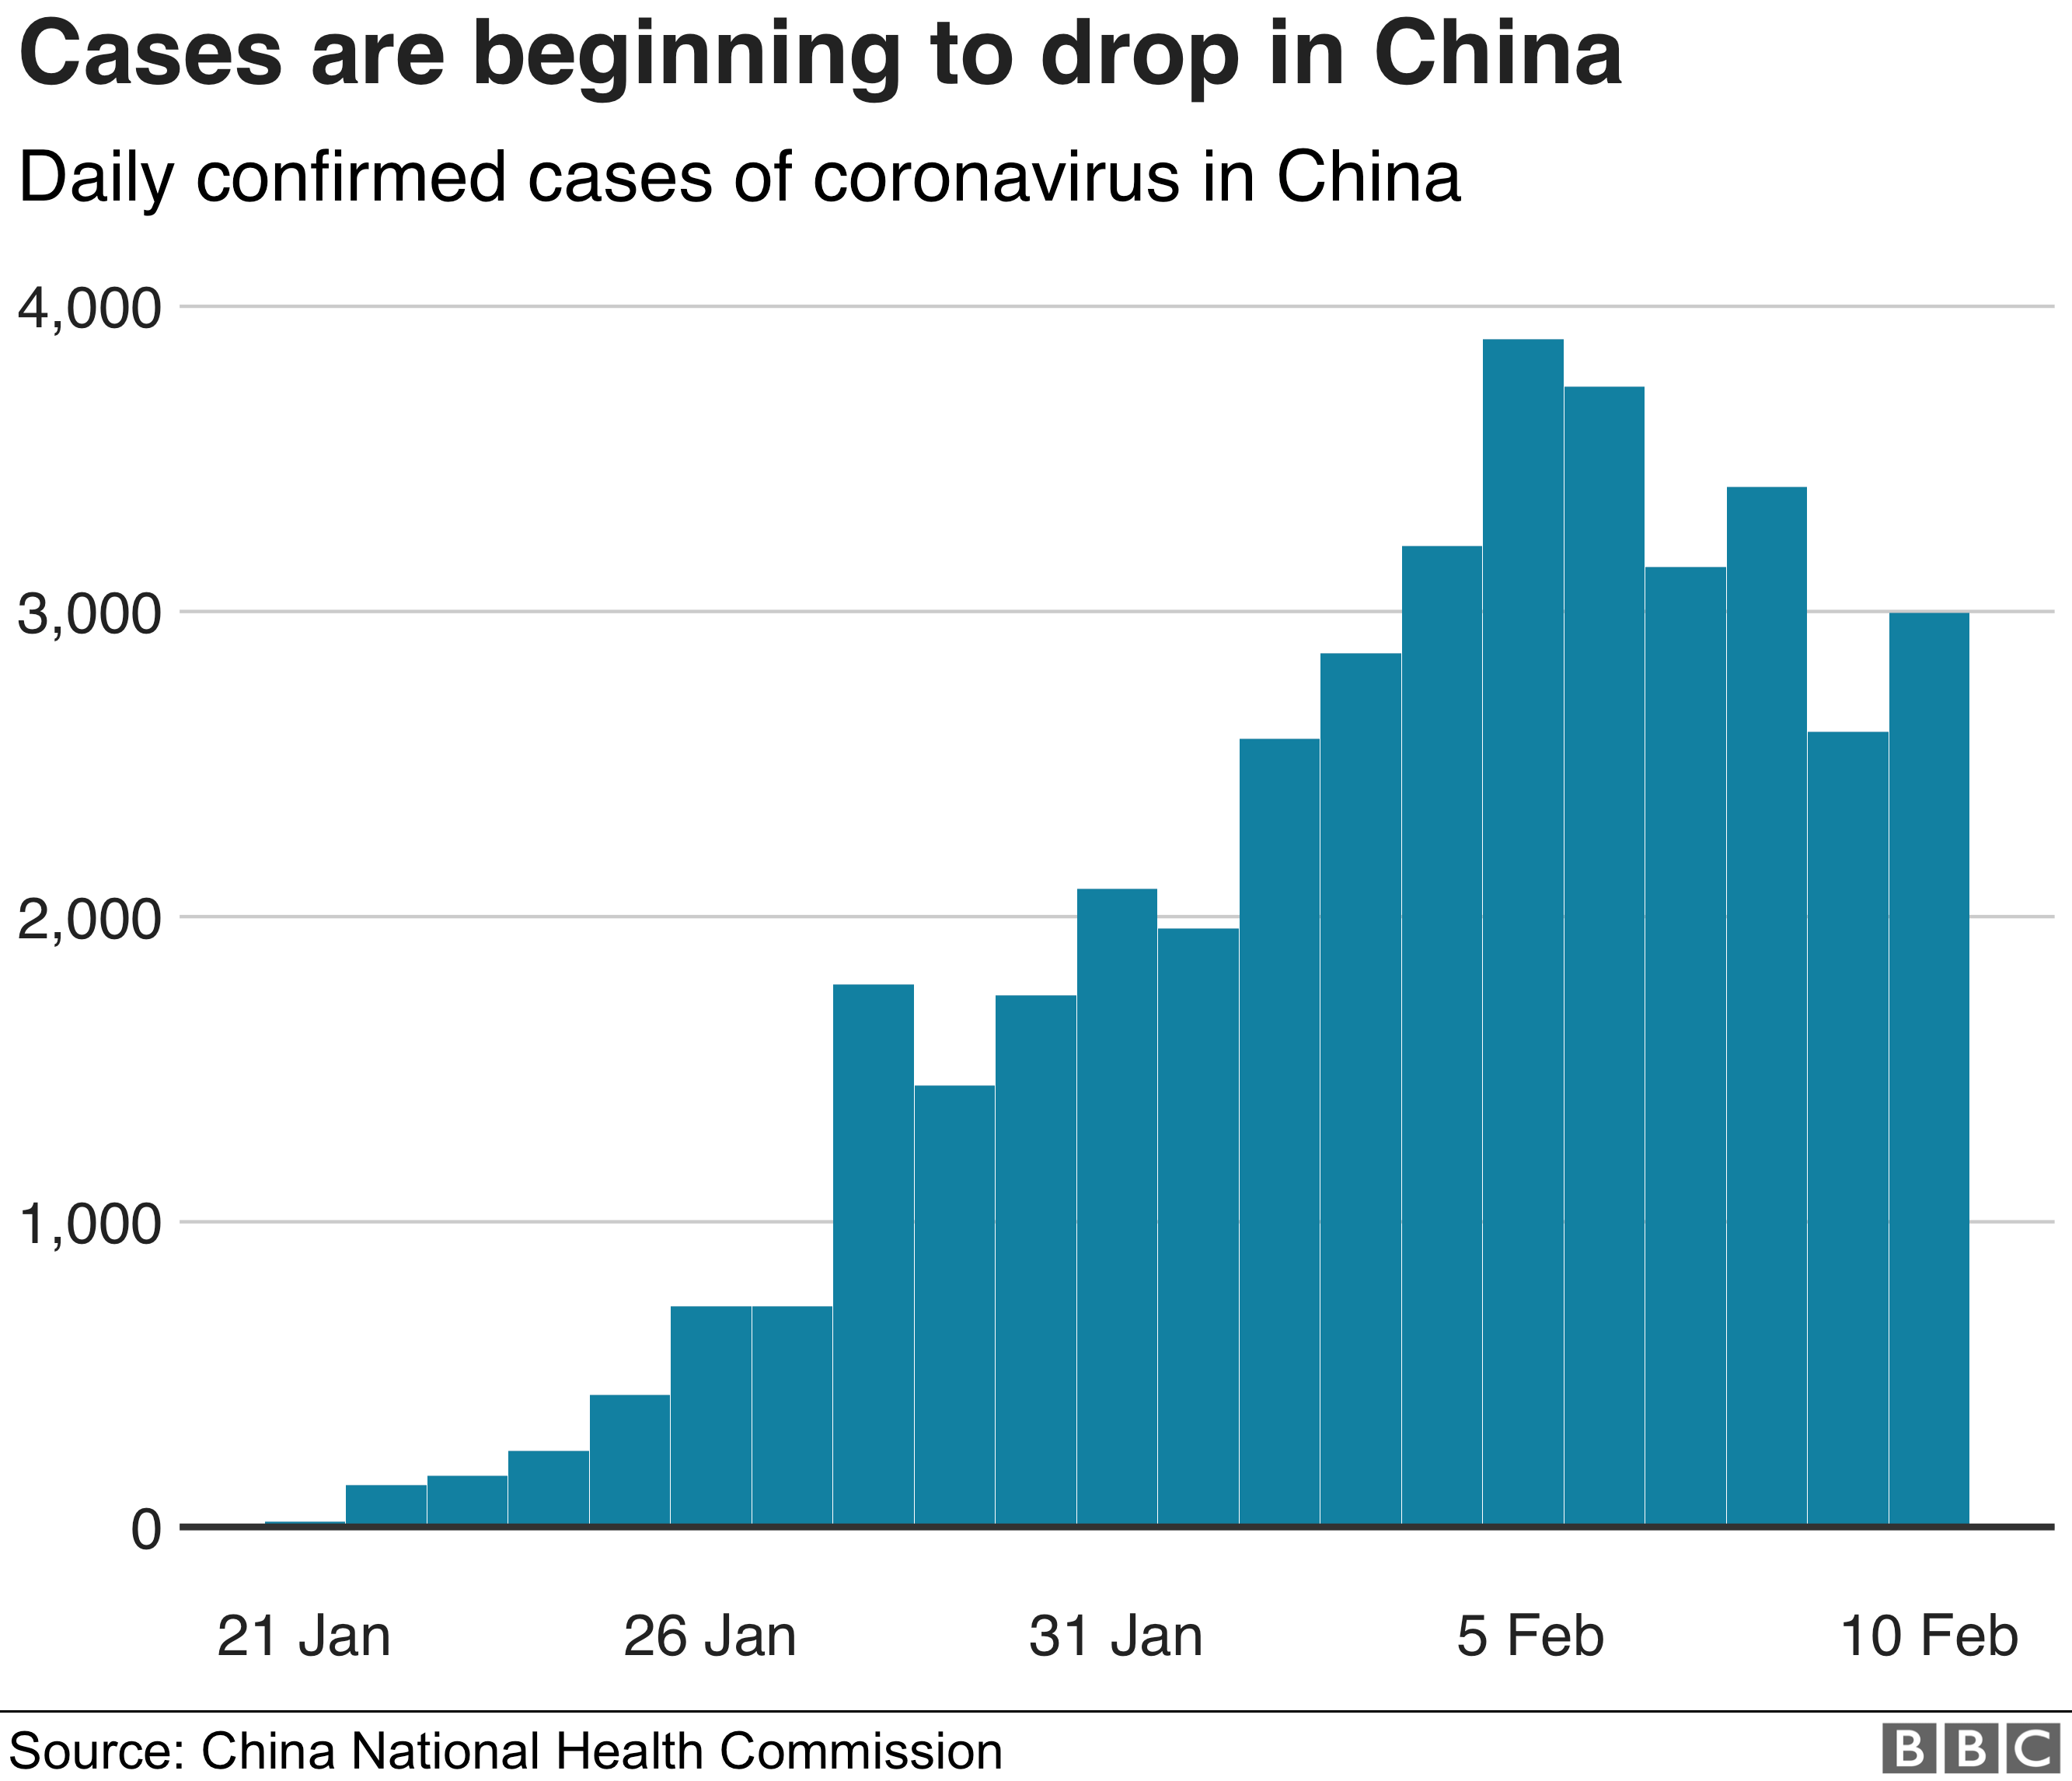
Head of the WHO’s health emergencies programme Dr Mike Ryan told a news conference the stabilisation “may reflect the impact of control measures put in place”.
But he warned against assuming the virus had plateaued.
Epidemics can slow down and then accelerate again, infectious disease experts say.
- Coronavirus kills 97 in deadliest day so far
- Why much of ‘the world’s factory’ remains closed
- Your questions answered

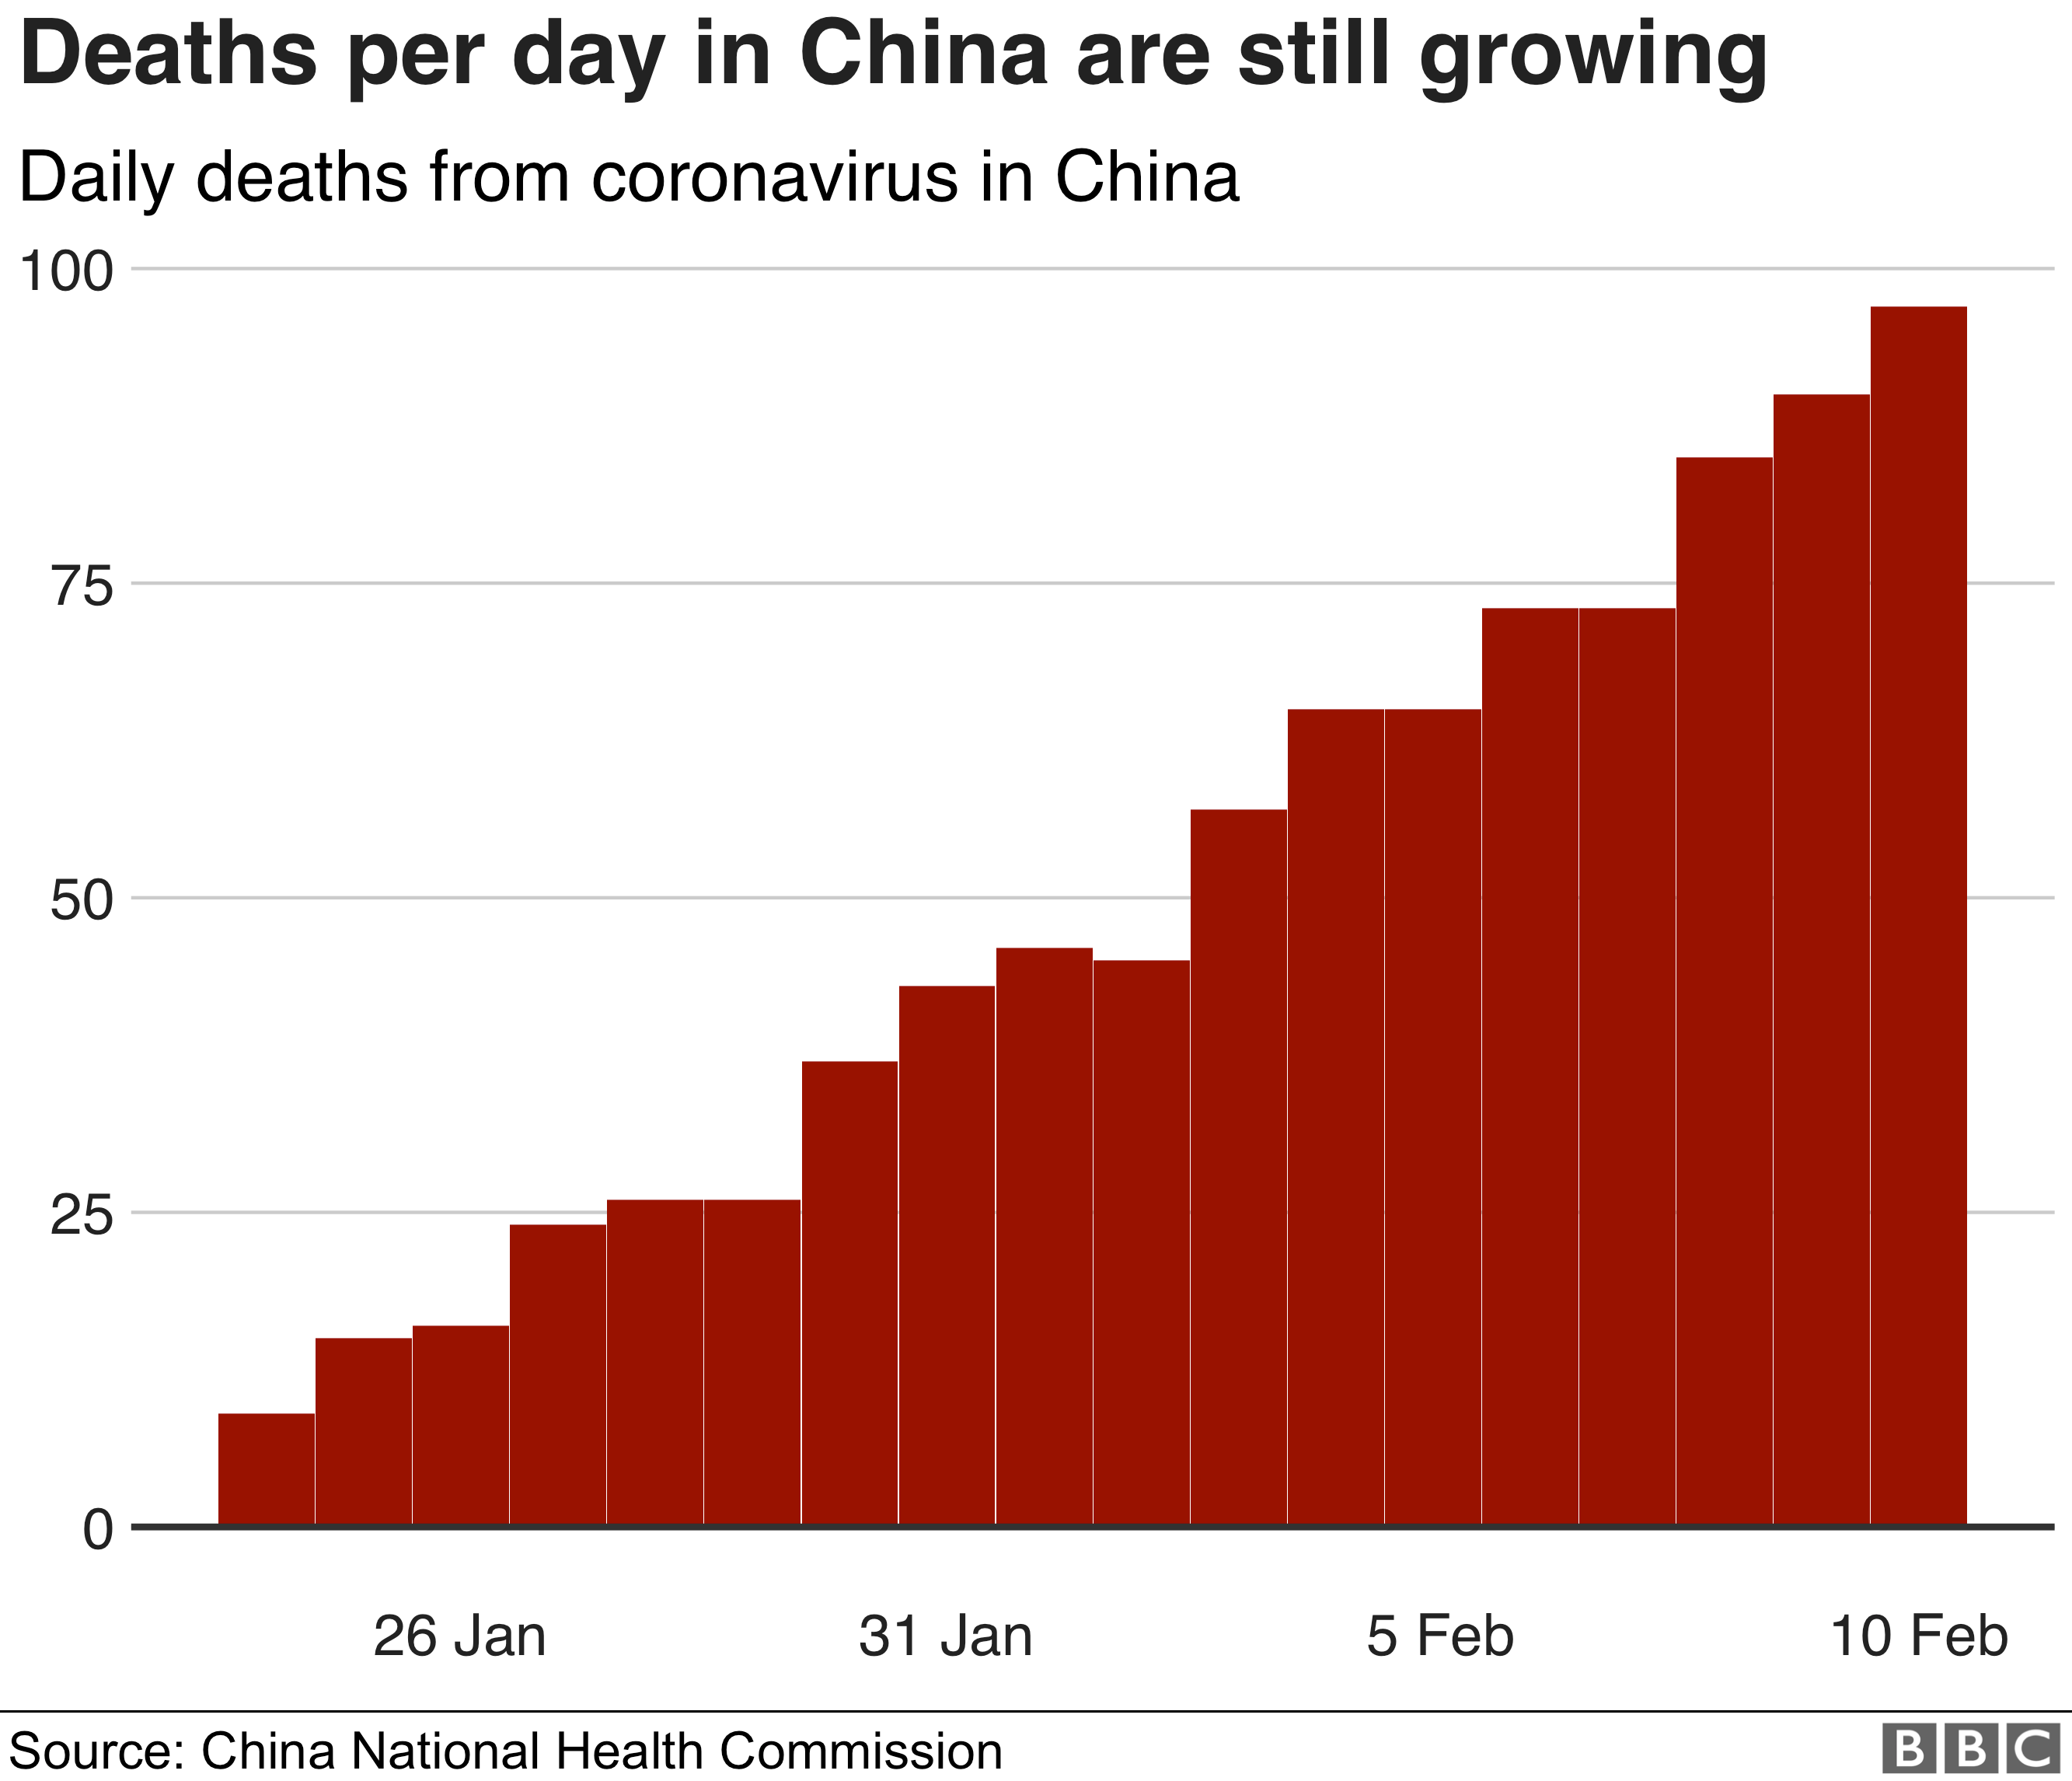
2. Daily deaths are rising
China has recorded its highest number of deaths in a single day from the new coronavirus, with 97 people dying on Sunday.
Figures released by the Chinese authorities show the number of daily deaths has risen steadily since the end of January.
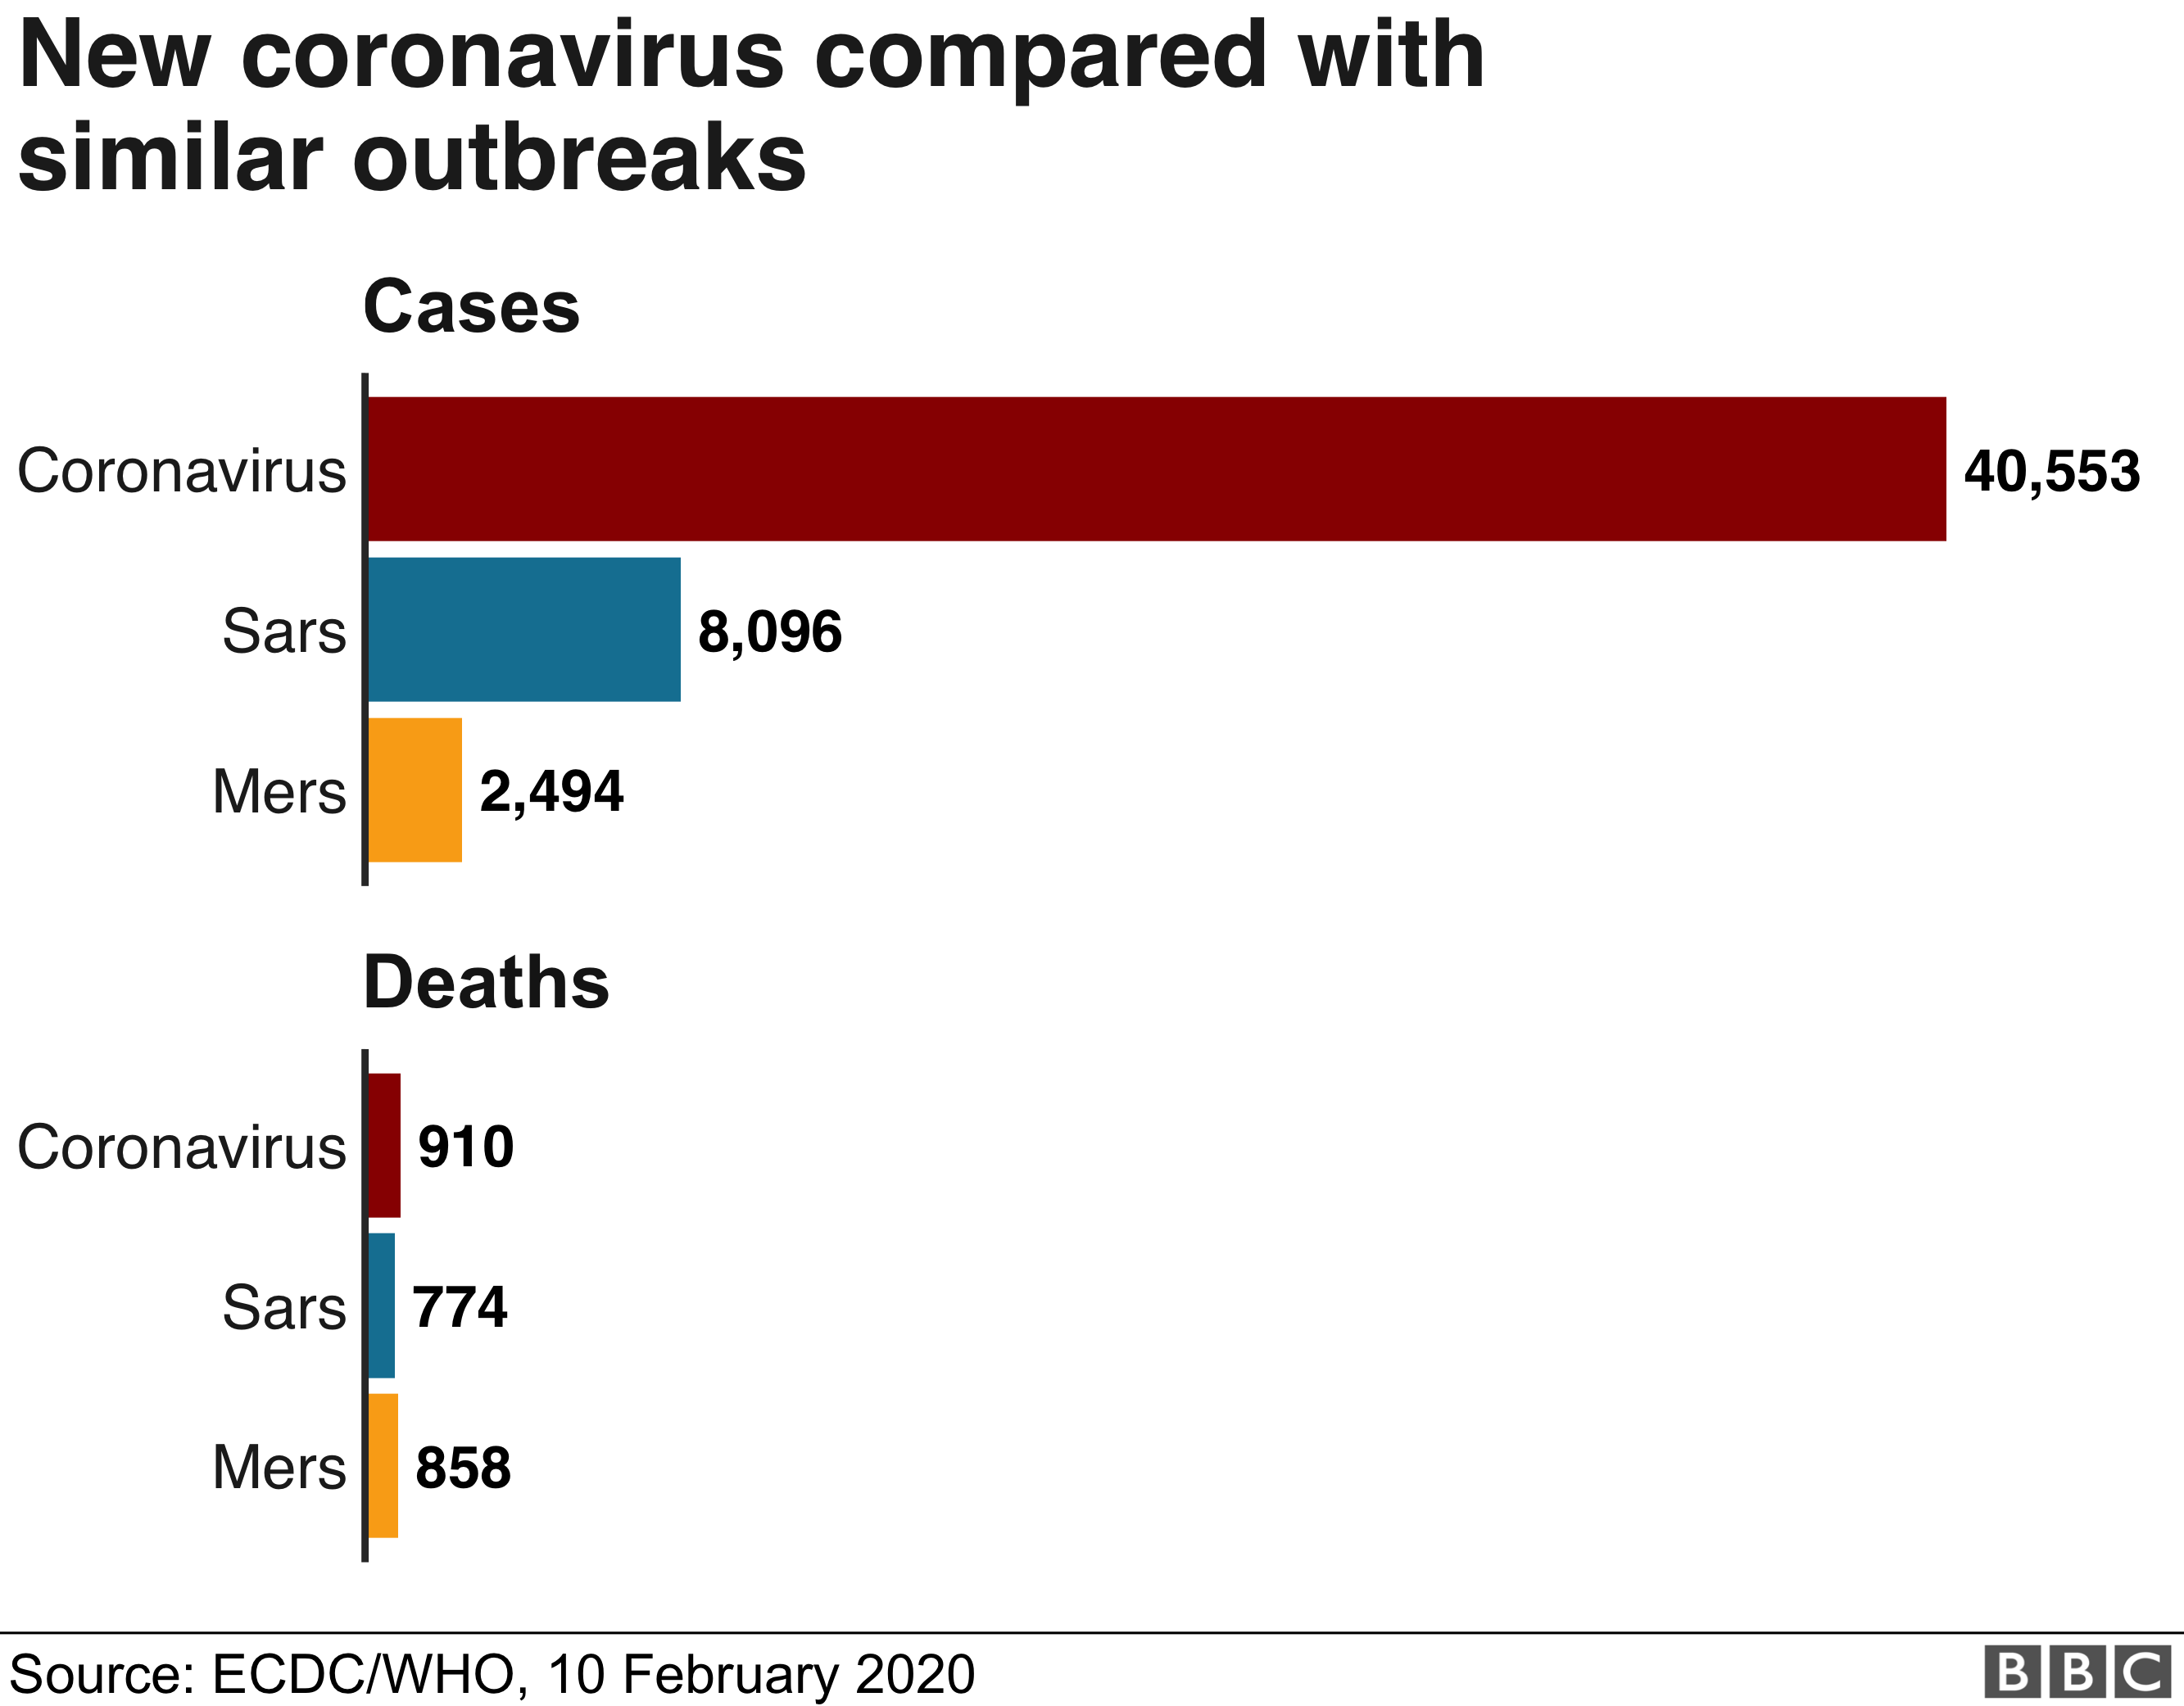
The number of coronavirus cases and deaths have both overtaken that of the 2003 Sars epidemic, which also originated in China and killed 774 people.
There were around 8,100 cases of Sars – severe acute respiratory syndrome – reported during the eight-month outbreak.
3. China introduced a number of measures to try to halt the virus’s spread
Tight restrictions to contain the disease remain in place in China, despite some workers heading back to their jobs following an extended Lunar New Year holiday.
Authorities have cancelled flights, closed factories and schools and ordered some cities to go into lockdown in a bid to reduce infections.
Many companies are opening a selected number of workplaces as well as limiting staff numbers and staggering working hours.
Hubei province remains the worst affected, seeing by far the biggest number of cases of the virus as well as most of the deaths.
Its capital city of Wuhan, home to 11 million people, remains virtual lockdown, with its train stations and airports shut and its roads sealed.
The origins of the new coronavirus have been linked to illegally traded wildlife at Wuhan’s seafood market, which sells live animals including bats, rabbits and marmots. However, the exact source of the outbreak has not been identified.