IMF Austerity is Alive and Increasing Poverty and Inequality
Posted on February 23rd, 2022
By Rebecca Ray Courtesy The Boston University Global Development Policy (GDP)

For many years, researchers have debated the International Monetary Fund’s (IMF) use of austerity, or required fiscal budget tightening: how common it is, which borrowers receive such requirements, whether IMF practice has changed after successive financial crises, and what impacts such austerity has had.
Two new working papers from the Boston University Global Development Policy Center (GDP Center) pushes these questions further. Using a new dataset that measures the depth of required fiscal adjustment in each agreement from 2001-2018, these papers reveal four main findings.
From IMF Austerity Since the Global Financial Crisis: New Data, Same Trend, and Similar Determinants” by Rebecca Ray, Kevin P. Gallagher, and William Kring:
- IMF-required austerity is commonplace and did not diminish in intensity after the 2008/2009 financial crisis.
- Borrowing countries are less likely to face required austerity if they are strongly tied to Western Europe, either through trade or diplomatic channels, or if they receive significant aid from non-OECD countries (mostly China).
From Poverty, Inequality, and the International Monetary Fund: How Austerity Hurts the Poor and Widens Inequality,” authors Thomas Stubbs, Alexander Kentikelenis, Rebecca Ray, and Kevin P. Gallagher:
- Borrowing countries are more likely to face austerity if they are host to significant foreign direct investment (FDI), particularly from Western Europe.
- IMF-required austerity is significantly associated with rising inequality, by increasing the income share to the top ten percent at the expense of the bottom 80 percent. Unsurprisingly, the impact can also be seen in significantly rising poverty levels in countries facing tighter austerity requirements.
How does the dataset measure the depth of IMF-required fiscal adjustment?
Over the last year, researchers at the GDP Center have created a new dataset on the depth of fiscal adjustment required in IMF agreements. By incorporating this new variable, the researchers pushed beyond explorations of who receives conditionality, to how lenient or harsh each agreement has been. This new data, which the working papers are based on, will be made public upon journal publication.
This dataset includes all IMF agreements since 2001 with binding fiscal adjustment targets (known as quantitative performance criteria, or QPCs) at the end of calendar years. By limiting the sample to end-of-year QPCs, it allows each fiscal adjustment requirement to be measured as a share of calendar-year GDP. These annual measures are then compared across the length of the agreement to produce cumulative, annualized fiscal adjustment, in percentage points of the borrower’s nominal GDP. Positive numbers indicate government budgets that were required to tighten (or become more positive), while negative numbers indicate agreements that allowed government budgets to loosen (or become more negative).
This dataset takes only the final level of each QPC, after any adjustments or revisions, and it ignores any that were waived because of extenuating circumstances. After all of these factors were taken into account, and after removing a few extreme outliers in unusual circumstances (for example, Iraq shortly after the ouster of Saddam Hussein), it resulted in a dataset of 335 QPCs from 154 IMF arrangements across 18 years.
How much fiscal adjustment did the IMF require from 2001-2018?
In the first of the two new working papers, IMF Austerity Since the Global Financial Crisis: New Data, Same Trend, and Similar Determinants,” coauthors Rebecca Ray, Kevin P. Gallagher, and William Kring find a remarkable variability in the fiscal tightening (or loosening) required across IMF agreements. While required fiscal adjustments always averaged between one percent of GDP cut or added to borrowers’ budgets for every year in the sample, Figure 1 below shows that the arrangements include a wide variety of experiences, even after removing the outliers mentioned above.
Figure 1: IMF-imposed Fiscal Adjustment in % of Borrower GDP per year, 2001-2018
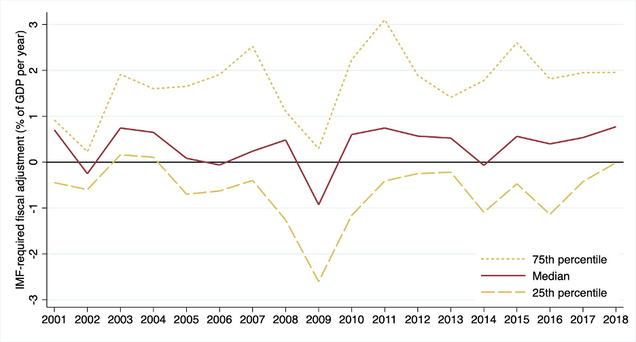
Source: Ray, Gallagher and Kring, 2020, Figure 2.
Some of this variation is due to the diversity of economic situations faced by IMF borrowers, like the type of arrangement they entered, or their income levels, economic growth, and inflation rates at the time of their IMF arrangement. When considered together with these factors through an ordinary least squares regession model, the IMF agreements coalesce around a narrower range. Figure 2 below shows the predicted fiscal adjustment levels and 95 percent confidence intervals across the dataset, resulting from that process:
Figure 2: Modeled IMF-Imposed Fiscal Adjustment in % of Borrower GDP per year, 2001-2018
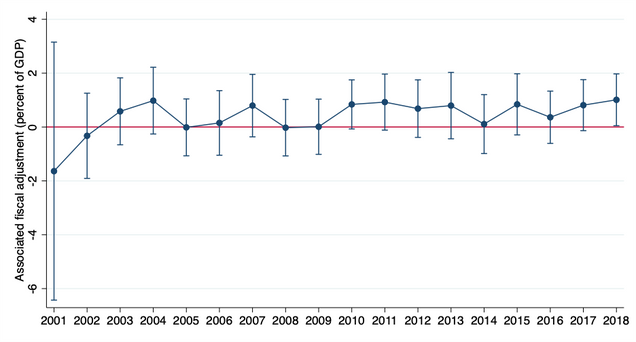
Note: Bars represent 95 percent confidence intervals. Source: Ray, Gallagher and Kring, 2020, Figure A1.
These results run counter to recent research on the IMF rhetoric and the text of agreements, which often find that the agreements grew more lenient after the 2008/2009 financial crisis. In fact, Figure 3 below shows no significant trend at all across this time period, in terms of the fiscal adjustment actually required by the agreements. Average predicted fiscal adjustment appears to have dipped in 2008 and 2009 (though not statistically significantly so) before rebounding to its prior levels. In fact, the only year with predicted fiscal adjustment that is statistically significantly greater than zero is the most recent year in the dataset, 2018.
Which countries gets more austere or lenient IMF arrangements?
The same working paper also finds that IMF-required austerity wasn’t evenly distributed among all borrowers, or even all borrowers facing similar economic pressures. Even after taking into account each country’s economic situation, the authors find that countries’ foreign economic and diplomatic relationships mattered in setting the stage for the terms of IMF programs. Figure 3 shows the specific relationships that emerged as significant determinants of IMF austerity. For each variable, it shows the difference in IMF-required austerity that is associated with an increase of one standard deviation in each of the significant variables:
Figure 3: Significant Determinants of IMF-Required Fiscal Adjustment, 2001-2018
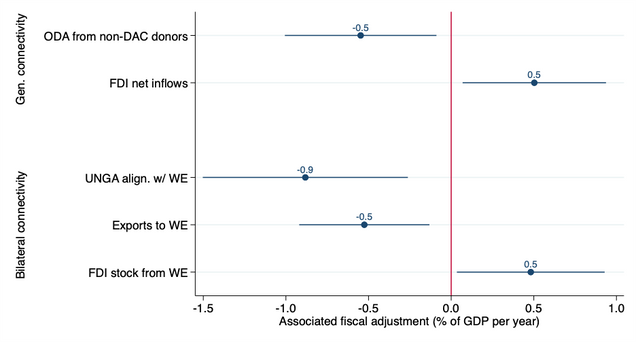
Note: Bars indicate 95 percent confidence intervals. Source: Ray, Gallagher and Kring, 2020, Fig. 3.
As Figure 3 above shows, three of these variables were associated with significantly more lenient (less austere) IMF agreements.
The strongest of these impacts is a country’s diplomatic relationship with Western Europe, measured as its average voting alignment with Germany, the UK, and France at the UN General Assembly (UNGA). An increase of one standard deviation in this variable was associated with IMF agreements that were less austere by a whopping 0.9 percent of GDP per year.
Borrowers’ trade relationship with Western Europe was also associated with significantly less austerity: an increase of one standard deviation in a country’s exports to France, Germany, and the UK (from 1.8 percent to 5.6 percent of GDP) was associated with an average of 0.5 percent of GDP less in required fiscal tightening per year.
Finally, aid (official development assistance, or ODA) received from sources outside of the rich countries that make up the Organization for Economic Co-operation and Development’s Development Assistance Committee (DAC) seems to act as a buffer on countries’ willingness to accept harsh IMF conditionality. An increase on one standard deviation in aid from non-DAC countries (from $25 to $54 per capita) is associated with QPCs that are an average of 0.5 percent of GDP less austere per year. It is worth noting that this non-DAC aid is most likely to come from China. This reinforces another recent GDP Center working paper showing that countries may approach China as an alternative to seeking IMF assistance.
In contrast, two additional variables are associated with greater austerity in IMF agreements: a country’s role as a host for foreign investment, generally, and from Western Europe specifically. An increase by one standard deviation in net FDI inflows (from 3.4 percent to 9.3 percent of GDP) is associated with QPCs that require 0.5 percent of GDP tighter fiscal adjustments: the same impact as an increase by one standard deviation in the FDI in-stocks from Western Europe (from 0.3 percent to 2.2 percent of GDP). These findings bolster the growing literature on tight fiscal policy being associated with the influence of foreign investors.
What happens after austerity is enacted?
Austerity often falls on the shoulders of the nation’s most vulnerable people.
With this in mind, an additional GDP Center working paper explores the impact of IMF-imposed fiscal adjustment on inequality and poverty, using the same dataset. In this new paper, Poverty, Inequality, and the International Monetary Fund: How Austerity Hurts the Poor and Widens Inequality,” authors Thomas Stubbs, Alexander Kentikelenis, Rebecca Ray, and Kevin P. Gallagher find that greater IMF-imposed austerity is associated with increased inequality and poverty in borrower countries.
Figure 4 below summarizes the findings of ten separate regression models, showing the impact of IMF austerity on the income share of each income decile (each representing ten percent of the population), from the poorest ten percent (decile one) to the richest ten percent (decile ten).
The results show a statistically significant negative effect of fiscal adjustment on the income share of the bottom 80 percent of the population: income deciles one through eight. For the top ten percent — decile ten — the effect of the IMF adjustment coefficient turns positive and is large relative to the other deciles (coefficient, 0.198).
In other words, IMF-required austerity is significantly associated with the highest earners receiving more at the expense of the bottom 80 percent. The biggest losses are accrued by middle-class earners, in deciles six through eight, plausibly a product of wage, employment, and pension cuts for civil servants.
Figure 4: Impact of IMF-Required Fiscal Adjustment on Income Share to Each Decile, 2001-2018
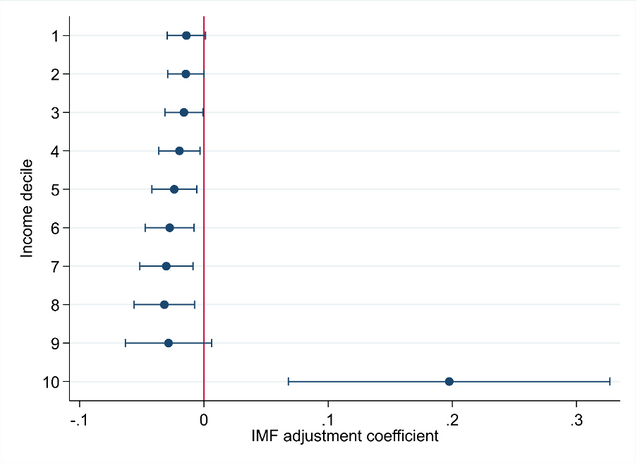
Source: Stubbs et al, 2021, Fig. 1.
These results have serious implications for families facing poverty. Figure 5 below shows the results of a model of the impact of IMF-required austerity on the poverty rate at $2.50 per person, per day. This model varies IMF fiscal adjustment and averages the remaining covariates in the sample. It finds IMF-mandated austerity to be significantly associated with higher poverty rates.
For example, fixing IMF fiscal adjustment at five percentage points (requiring government budgets be tightened by five percent of GDP per year), our model would predict a poverty headcount at 27.35 percent of the population, compared to 24.83 percent with no adjustment.
Figure 5: Impact of IMF-Required Fiscal Adjustment on Poverty Rates, 2001-2018
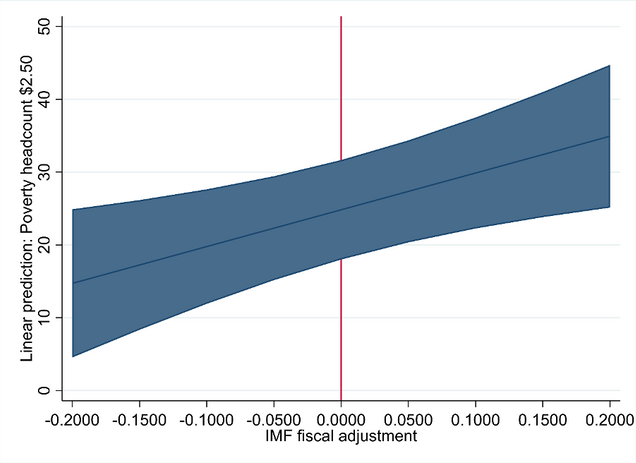
Source: Stubbs et al, 2021, Fig. 2.
What now?
As the IMF holds its annual Spring Meetings the first week of April in Washington, D.C., it faces a changed world.
The COVID-19 pandemic has ravaged economies around the globe, with the poorest regions hit hardest: Sub-Saharan Africa and Latin America and the Caribbean each saw their regional economies shrink by over six percent last year, while emerging Asian economies (excluding China) shrank by eight percent.
Amidst the global economic instability, international investors fled developing economies, before returning after vaccines were announced, creating significant exchange rate instability, which can make a country’s dollar-denominated debt obligations unsustainable, even if they were within a normal range before the pandemic. It can also wreak havoc on a country’s balance of payments, creating just the type of international financial instability the IMF was created to address.
As the IMF responds to these crises, encouraging signs have emerged that the Fund may be treating this crisis with special care. The GDP Center’s IMF COVID-19 Recovery Index shows that IMF arrangements in 2020 and 2021 have begun to directly target maintaining or increasing health spending, for example, though rarely in binding ways.
But as these GDP Center working papers show, broader austerity matters as well. The IMF would be well served to take its recent progress and expand it to apply to austerity generally, or at the very least, work to ensure that required austerity does not worsen inequality and poverty in borrowing nations as they work to recover from the COVID-19 crisis.